Optimizing a profile with the Colormunki Software. Does it make it better???

Ink stained Fingers

Printer VIP
Platinum Printer Member
Joined
Dec 27, 2014
Messages
6,062
Reaction score
7,234
Points
363
Location
Germany
Printer Model
L805, WF2010, ET8550
quite interesting indeed, I'm not using Colormunki, but this article explains some of what the opt. process is doing.
https://www.xrite.com/colormunki-design/support/kb4430
Could you send me the original target patch sheet as a .tiff or .pdf file, and I could load that into the Monaco Gamut viewer showing where the color spots actually sit in the color space.
 
Last edited:

paulcroft

Fan of Printing
Joined
Jan 11, 2010
Messages
74
Reaction score
39
Points
58
Printer Model
Canon Pro-100
Hi Joe

Just spotted something which doesn't make much sense to me - following your advice I've compared the Canon produced profile with it's ColorMunki 'twin' and the Canon one definitely has a greater volume. However, the Canon produced profile is 456 KB and all my ColorMunki profiles are 2309 KB. I wonder what's taking up all that space in the CM profiles if they translate to a smaller overall volume? :(
 

Ink stained Fingers

Printer VIP
Platinum Printer Member
Joined
Dec 27, 2014
Messages
6,062
Reaction score
7,234
Points
363
Location
Germany
Printer Model
L805, WF2010, ET8550
the gamut volumes don't vary as much as the file size difference may imply, I guess that ColorMunki adds interpolated points and values to the tables.
 

martin0reg

Printer Master
Joined
May 9, 2010
Messages
1,060
Reaction score
748
Points
273
Location
Germany Ruhrgebiet
Just a layman's question: does the optimized profile have to be always "bigger", extending the first one?
Or couldn't it be that the smaller one is matching better... in other words that the optimization in some cases may measure a smaller gamut, instead of a bigger?

While optimizing my CM profiles I have another issue: when I try to optimize profiles for B&W using a grayscale test photo, the new rendered test pattern contains only around 10 different gray patches at tne most, the rest of the 50 patches stay simply black and white. How can you make the software use all 50 patches with 50 new colors.. for B&W resulting in 50 shades of gray?
 

Ink stained Fingers

Printer VIP
Platinum Printer Member
Joined
Dec 27, 2014
Messages
6,062
Reaction score
7,234
Points
363
Location
Germany
Printer Model
L805, WF2010, ET8550
I'm not using Colormunki, but the old X/Rite Profile Maker software, and with it the even older Monaco GamutWorks Viewer which has some nice features.

sRGB.jpg
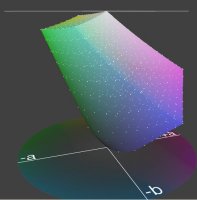
I'm displaying here the sRGB color space, in actual colors and within this colorspace white spots which are the colors of the spots of my profile target with 968 fields. These spots either sit on the
outer surface of the color space volume or are visible within - evenly distributed. All sections of the gamut are equally well covered with measurement points on which the profile generation software is based on, creating a correction value for these from the scanned printoit.
If I could get a .tiff or .pdf file of the Color Munki target I could add this here as well, and it would show where the target spots within the gamut are located, and as well those of the optimization step. If Color Munki does not let you save the target as a file, you maz print it with a PDF writer into a .pdf file.
I don t think the opt. process is supposed to expand the gamut overall but to add some more measurement points to the process to make the profile more accurate in this area.
 
Last edited:

jtoolman

Printer Master
Platinum Printer Member
Joined
May 7, 2011
Messages
1,949
Reaction score
940
Points
277
Location
United States
Printer Model
All of them! LOL
quite interesting indeed, I'm not using Colormunki, but this article explains some of what the opt. process is doing.
https://www.xrite.com/colormunki-design/support/kb4430
Could you send me the original target patch sheet as a .tiff or .pdf file, and I could load that into the Monaco Gamut viewer showing where the color spots actually sit in the color space.
I don't think I can do that. the CM does not generate files like the other higher end X-rite profilers. The first set is generated, you print, you scan then a CUSTOM set is generated dependent on the results of the first scans which you print and scan, finally it generates the profile from the last scan.

Joe
 

jtoolman

Printer Master
Platinum Printer Member
Joined
May 7, 2011
Messages
1,949
Reaction score
940
Points
277
Location
United States
Printer Model
All of them! LOL
Just a layman's question: does the optimized profile have to be always "bigger", extending the first one?
Or couldn't it be that the smaller one is matching better... in other words that the optimization in some cases may measure a smaller gamut, instead of a bigger?

While optimizing my CM profiles I have another issue: when I try to optimize profiles for B&W using a grayscale test photo, the new rendered test pattern contains only around 10 different gray patches at tne most, the rest of the 50 patches stay simply black and white. How can you make the software use all 50 patches with 50 new colors.. for B&W resulting in 50 shades of gray?

Exactly what I've noted. I was hopping someone would explain that in NON Color Engineering Terms that dummies like me can understand.

Joe
 

jtoolman

Printer Master
Platinum Printer Member
Joined
May 7, 2011
Messages
1,949
Reaction score
940
Points
277
Location
United States
Printer Model
All of them! LOL
Which
I'm not using Colormunki, but the old X/Rite Profile Maker software, and with it the even older Monaco GamutWorks Viewer which has some nice features.

View attachment 3572
I'm displaying here the sRGB color space, in actual colors and within this colorspace white spots which are the colors of the spots of my profile target with 968 fields. These spots either sit on the
outer surface of the color space volume or are visible within - evenly distributed. All sections of the gamut are equally well covered with measurement points on which the profile generation software is based on, creating a correction value for these from the scanned printoit.
If I could get a .tiff or .pdf file of the Color Munki target I could add this here as well, and it would show where the target spots within the gamut are located, and as well those of the optimization step. If Color Munki does not let you save the target as a file, you maz print it with a PDF writer into a .pdf file.
I don t think the opt. process is supposed to expand the gamut overall but to add some more measurement points to the process to make the profile more accurate in this area.


Which target? The single one that is created during optimizing? It is only held in RAM and I suppose one could print to PDF but commonly the CM systems do not produce files you can save!

Joe
 

Ink stained Fingers

Printer VIP
Platinum Printer Member
Joined
Dec 27, 2014
Messages
6,062
Reaction score
7,234
Points
363
Location
Germany
Printer Model
L805, WF2010, ET8550
my image above shows the target I'm using, and how the target color spots fit into the color space, and how they are distributed across the gamut volume. I hoped I could show the same using the Colormunki target which uses much less spots than my target - 918 vs. 50. I tried to install Colormunki but without the device I cannot even get into a demo mode. If you could print the target to PDF please, not to your printer, with a PDF writer as a virtual printer generating a PDF file from the print output I would use that for illustration. There are several of those, Acrobat, CutePDF and others. I'm not looking to the opt. target yet. But when looking to http://www.colormunki.com/munsell# under the 'Images' tab there are a range of images and apparently those colors used for the additional optimization process extracted from these images. Since I'm not using Colormunki I don't have an idea what the button to the right does ' Add all patches to my pallet'.
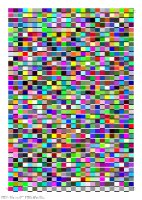
This is my standard target
Target.jpg
and the color values of all the spots are recalculated into Lab values and displayed above in a
3D Lab viewer, and each target spot is a pixel in the color space. It is quite an unusual display of the target data, but this function of the Gamut viewer can be used with about every image which then shows it as a pixel cloud in the color space
 
Top