Optimizing a profile with the Colormunki Software. Does it make it better???

martin0reg

Printer Master
Joined
May 9, 2010
Messages
1,060
Reaction score
748
Points
273
Location
Germany Ruhrgebiet
I have once saved a CM testchart, but only one single optimizing chart, I just wanted to know if it's possible. And how... I think I used "print to file"..

ISF, I guess you need all three charts to analyze in your software, the two regular and the third (or more) for optimizing. I will try to save all next time...
 

Attachments

  • Druckindatei-CMtestchart_CM-KLA-opt1.pdf
    4 KB · Views: 349
Last edited:

jtoolman

Printer Master
Platinum Printer Member
Joined
May 7, 2011
Messages
1,949
Reaction score
940
Points
277
Location
United States
Printer Model
All of them! LOL
You can not just print the first target and use it. You need both targets! The primary and then the CUSTOM secondary one which differs every time you create one because it depends on the scanning results of the first target. CM uses a totally different system than anything you may have tried in the past.
However the CANON Color Management Tool does produce a set of three target sheets which you could " Print " to PDF. Just not the CM. The complete process takes place inside the software.

You HAVE to actually Physically print the first standard set which is 50 patches and scan it to be able to produce the second set of targets. It is from THOSE second 50 patches that the profile is generated!

There is no way to circumvent the system and make it operate like what you are used to, which is to generate a set of MANY color patches which are printed and scanned resulting in a Profile.

Joe
 

Ink stained Fingers

Printer VIP
Platinum Printer Member
Joined
Dec 27, 2014
Messages
6,110
Reaction score
7,297
Points
373
Location
Germany
Printer Model
L805, WF2010, ET8550, T3100X
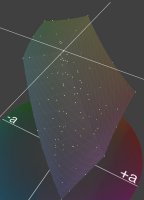
Here are the target color spots of martin0reg's CM test chart from above placed in the Lab color space, with the color values as their coordinates, the spots are very sparsely distributed. I guess XRite has quite some knowledge how to interpolate between those spots to come to a decent profile. Gamutworks actually displays the data such that the color cube can be turned and tilted in any direction easily, that makes it easy to see which pixels are in the front or in the back, this functionality gets lost just with the display of just one screenshot here. It's more for illustration than for a detailed analysis. And the opt. process will add a few more spots depending on the additional image you are using for the opt. process.
CM-target in sRGB.jpg
 

martin0reg

Printer Master
Joined
May 9, 2010
Messages
1,060
Reaction score
748
Points
273
Location
Germany Ruhrgebiet
....which you could " Print " to PDF. Just not the CM. The complete process takes place inside the software.
You HAVE to actually Physically print the first standard set which is 50 patches and scan it to be able to produce the second set of targets. It is from THOSE second 50 patches that the profile is generated!

There is no way to circumvent the system and make it operate like what you are used to, which is to generate a set of MANY color patches which are printed and scanned resulting in a Profile.
Joe
I think IsF don't want to use these targets for profiling (like one single target for argyll...this I agree could not work) but for analizing the resulting profile.
And regarding saving or printing: it's possible with CM software to save without printing, see my posting!


I don't really know if I could go through the CM process using these saved files and get the same profile, but I will try.
Because any time when it goes to printiing the chart, there is an option "already printed" - and you could actually measure the saved chart which you would print outside CM with the exact printer settings...


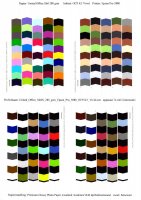
PS just found a jpg image of four charts, which I found somewhere in the forum (or at dpreview, probably by pharmacist). It's a small image but perhaps might be useable, for analizing the CM process ..??
top left: first, top right: second (these two are needed for a CM profile)
bottom left: optimize, bottom right: optimize (second..I guess..)
colormunki_profile_epson_pro_3880_ocp-k3-jpg.616.jpg
 
Last edited:

Ink stained Fingers

Printer VIP
Platinum Printer Member
Joined
Dec 27, 2014
Messages
6,110
Reaction score
7,297
Points
373
Location
Germany
Printer Model
L805, WF2010, ET8550, T3100X
thanks for the image, I may not have been clear enough, I'm not planning to or be able to create a Colormunki profile, I just like to see where their target color spots are located in the color space, those 2x50 spots. The use of an interim .PDF file as a virtual output was described somewhere else in another forum to profile a remote printer which is not connected to the system on which the Colormunki software is running, It takes time to send back the printouts for scanning but it apparently would work.
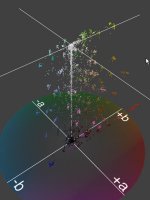
When I take the above Colormunki target file with 4x50 patches and load them for display , with their color values as the coordinates in the color space I get this
colormunki_profile.jpg

Oops, lots of litle color clouds , what happened? It is a .jpg file, and when you compress and uncompress the data the compression algorithm creates lots of additional colors, this .jpg file contains 83.600 different colors, and not 4x50 what you may have expected. And all these different colors show up as separate pixels in the color space display in the vicinity of the original color.
When you crop the image very much you get this
colormunki_profile artifacts.jpg
and you see at the edges lots of little color variations, this file is only 300x200=60.000 pixels and contains
already 8700 unique colors (as measured with a ThumbsPlus function)
So using .jpg files in a profiling process is creating additional colors you definitely don't want there, using .tiff files is the only option besides uncompressed .pdf files.
 
Last edited:

martin0reg

Printer Master
Joined
May 9, 2010
Messages
1,060
Reaction score
748
Points
273
Location
Germany Ruhrgebiet
I am profiling a new old R800, the first exemplar I got from ebay which is not worn out, seems to be a good one.. (I like this printer.. it sounds and runs like a sewing machine - if it runs at all..)

For analyzing a complete set of CM targets and the resulting profiles, I have saved the generated targets as PDF's. This is possible, beside the actual printing with the R800, by "print to file" and choosing a virtual PDF-printer-driver.
I printed these PDF's after the normal CM process of profiling, with the same R800 printer settings, and the printed targets are looking the same to my eyes.
So if you want to analyze some more CM profiling and optimization, here are the 4 targets and the 3 resulting profiles (for some cheap matte inkjetpaper of 120g)
Target 1 and 2 are mandatory for a CM profile, the second is based on the first. For target 3 and 4 (optimize) you have to load a photo, I took the printer evaluation image from outbackphoto for opt 1 and the northlight BW test image from northlight for opt 2

PS: now when I see the size of the PDF-files, I'm surprised... they printed out well anyway..
PPS: I admit I see hardly a difference in the printer output of the three profiles, the first is as good as the two optimized to my eyes, actually..
 

Attachments

  • CMtestchart1-4_r800.pdf
    12.8 KB · Views: 338
  • CM profile-r800.zip
    4 MB · Views: 394
Last edited:

Ink stained Fingers

Printer VIP
Platinum Printer Member
Joined
Dec 27, 2014
Messages
6,110
Reaction score
7,297
Points
373
Location
Germany
Printer Model
L805, WF2010, ET8550, T3100X
o.k., thanks for the PDF, that works and gives clean colors, I converted the pdf file into 4 .tiff files, 2 with 50 unique colors, the 3rd with 27 and the 4th with 12 gray values. Using these PDF files would allow you to profile a printer remotely which is not connected to that computer which runs the CM software, it may be slow nevertheless.
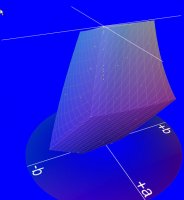
I loaded the first two patch files into the gamut viewer as before, every color of those 2x50 spots gets converted into Lab coordinates and and placed into the Lab color space. I added slightly shaded the outlines of the sRGB gamut to illustrate better where CM is actually placing the spots. You cannot turn the cube, so your view is limited, you cannot easily separate the spots whether they are in the front or back. The sRGB gamut has several corner points, and all are populated with a CM spot, these corner points are connected with edges, and there are one of two spots on all these edges as well.
And the other spots are distributed within the gamut shape. Target 3 and 4 are not included in this view, target 4 just would add those gray spots along the neutral L-axis, and target 3 adds some spots within a section of the gamut volume.
CM color spots.jpg
The relation between the actual ink amount and the saturation is not linear, using that few check points within the gamut requires colormunki to make quite some assumptions about these ink density/saturation curves to interpolate between the spots. We can assume that XRite has vast data about that and uses this intelligence when creating the profile.
This evaluation is just a starting pint, it does not give any information how 'good' the actual profile is, 'good' in the sense reproducing a color value correctly in print. This would require a scan or measurement of a profiled print of the targets , to compare it with the predefined spot values and to look for differences. This gamut viewer does not allow me to do that.
 

Ink stained Fingers

Printer VIP
Platinum Printer Member
Joined
Dec 27, 2014
Messages
6,110
Reaction score
7,297
Points
373
Location
Germany
Printer Model
L805, WF2010, ET8550, T3100X
those 3 icm-profiles , with 2 opt. steps, don't differ in the outline of their gamuts, the gamut viewer does not show what is happening inside with non-saturated colors , that's where the additional color spots are placed, the ColorMunki optimization process is not increasing the size of the gamut, the corners are already occupied by colors spots in the basic patch set for measurement.
 

RogerB

Print Addict
Joined
Sep 27, 2010
Messages
293
Reaction score
316
Points
183
Location
S.E. England
Printer Model
Epson Pro3880
those 3 icm-profiles , with 2 opt. steps, don't differ in the outline of their gamuts, the gamut viewer does not show what is happening inside with non-saturated colors , that's where the additional color spots are placed, the ColorMunki optimization process is not increasing the size of the gamut, the corners are already occupied by colors spots in the basic patch set for measurement.
I thought it may be helpful to see what GamutVision tells us about the profiles, so here goes.

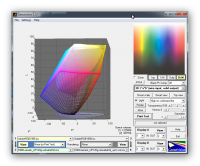
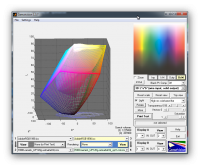
First, as ISF says, there is no useflul increase in the colour gamut after optimisation, although GV does show a very small increase.

Ashampoo_Snap_2015.11.19_13h56m56s_005_Gamutvision 1-3-7  .pngAshampoo_Snap_2015.11.19_13h57m07s_006_Gamutvision 1-3-7  .png
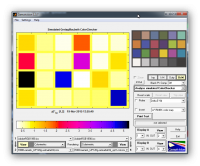
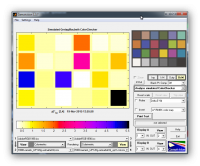
Second, the firsrt optimisation is different from the original, but there is no obvious increase in overall accuracy, at least for the colours in the CC24 set. It has to be said here however that because of the small colour gamut of this paper/ink combination, some of these colours are out-of-gamut. This explains the magnitude of some of the errors.

Ashampoo_Snap_2015.11.19_13h55m52s_003_Gamutvision 1-3-7  .png Ashampoo_Snap_2015.11.19_13h56m03s_004_Gamutvision 1-3-7  .png

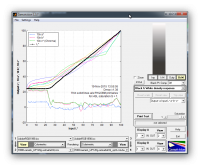
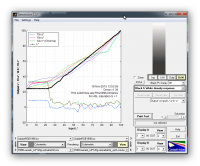
Lastly. the second optimisation using the B&W image actually may make the B&W response a bit worse! The original is quite smooth, whereas the opt2 has some worrying little kinks in the B&W response. Maybe not enough to be obvious in real life, but they shouldn't be there in an ideal world. And it looks as if the opt2 doesn't really improve the neutrality.

Ashampoo_Snap_2015.11.19_13h55m10s_002_Gamutvision 1-3-7  .pngAshampoo_Snap_2015.11.19_13h54m55s_001_Gamutvision 1-3-7  .png

At the end of this exercise I would say that optimisation does change the profile, but I wouldn't like to say whether or not it improves it; in the case of the B&W optimisation it may actually be a bit worse.
 

martin0reg

Printer Master
Joined
May 9, 2010
Messages
1,060
Reaction score
748
Points
273
Location
Germany Ruhrgebiet
...It has to be said here however that because of the small colour gamut of this paper/ink combination, some of these colours are out-of-gamut. This explains the magnitude of some of the errors.
...
At the end of this exercise I would say that optimisation does change the profile, but I wouldn't like to say whether or not it improves it; in the case of the B&W optimisation it may actually be a bit worse.
This seems to confirm my real world experience: the standard profile prints out astonishing well.. in most cases there is not much to "optimize".
As I said, it was indeed a cheap, cast coated and thin paper that I have profiled here (which I use a lot for quick and simple testing of printer ink settings etc..)

**edit** additionally I have to say that this R800 might have had one or two missing nozzles in the blue channel... I have this printer only since one week, getting to know its weak points day by day..

Would be interesting to compare with a high quality paper. I will save my next profile the same way, so that you experts of gamut could compare, if you want to..
 
Last edited:

Latest posts

Top