thebestcpu
Fan of Printing
- Joined
- Dec 8, 2024
- Messages
- 118
- Reaction score
- 70
- Points
- 60
- Printer Model
- Epson SC P900
Note: I just added the PPI vs. Circle diameter table that somehow did not transfer over with the initial post
I ran resolution tests for both PPI image settings and printer Print Quality Settings to determine my go-to settings for good images from my perspective. The test results might benefit others, so I am posting the results.
I limited my testing with the star chart to black-and-white on Epson Ultra Luster Paper, using the four print resolutions of 360, 720, 1440, and 2880 PPI and the three print quality settings of 720x1440 (superfine {SF}), 1440x1440 (photo{P}), and 1440x5760 (super photo{SP}) DPI. I enabled Finest Detail, Fast Speed, and Black Enhance Overlay settings for all the prints.
Here are my go-to results for my needs listed up front for those who just want my bottom line:
A Vector Image is used because the starting image has the same spikes at tremendous magnifications. I show the 314-spike Siemens Star with a box 150 mm wide on the left and a zoomed-in view in Photoshop at 340X of a box only 0.44 mm wide. The dark spot is the resolution limitation for my monitor.

When printed, the point at which you cannot resolve the individual spikes determines the resolution by the distance from the center. Equal resolution points are circles, and here is a table showing the diameter of such circles for the listed resolutions:

However, once you convert the vector star chart to a raster image, the resolution is constrained by the PPI of that image.
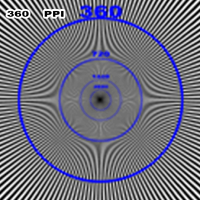
Here is an animation of the star chart at various image resolutions from 360 to 2880 PPI (the Image is before printing). Note that to make the star chart very clear at X PPI, you must have it rasterized at 2X PPI.

I printed 24 test charts to cover all the desired variations of settings. Twelve were for the topic of this post, and the other twelve are for a future post about the Finest Detail setting.
Here is an example of the star chart before printing. The print is 5.5x4.5 inches and includes an inset of the settings for the shot for better record keeping. The PPI used in the print was written by hand in the margin as they were printed.

The prints were photographed on a copy stand with a 45-Mpixel camera, macro lens, fixed exposure/aperture, and fixed lighting.
PRINT RESULTS
The first three prints are compared in a GIF animation. The animation starts with the star chart printed and then the three prints. The prints were all made at 360 DPI. Print Quality settings were SF=720x1440, P=1440x1440, and SP=1440x5760 DPI

The different quality settings make very little difference in resolution. The reason is that at a 360 PPI image, the resolution limitation is the starting image, which masks any higher resolution capabilities of the printer.
Of note is that each successive higher-quality setting provides a slightly cleaner line edge and a better reproduction of the resolution-limiting starting image.
The following animation is identical to the previous GIF, except the original image was created at 720 PPI.

Printing at 720 PPI is a big step up from printing at 360 PPI, and each successive printing quality level also shows a higher resolution. Additionally, the resolution varies based on the angle. At some angles, it reaches 720 PPI; at other angles, such as the north and south poles, it is worse.
Noticeably, the resolution improved decently from 720x1440 to 1440 x1440 print quality DPI. There is also some difference going from 1440x1440 to 1440x5760, yet the improvement is not as significant.
Is the printer resolution again limited by the original Image PPI? Does 720 PPI create a barrier to even higher resolution?
Here is the following animation with the original Image set to 1440 PPI and all other conditions the same.
NOTE:THIS GIF IS ZOOMED IN BY 2X compared to the prior GIFs

The 720x1440 resolution continues to disappoint. There is some incremental improvement over the Image PPI of 720, yet it is incremental. With 1440x5760, the resolution of the North /South poles also slightly improved.
I did not include the last three prints at 2880 PPI, as they showed no difference from the 1440 PPI image prints. They are at the resolution limits.
To quantify the nine prints I shared in the GIFs, I measured each for the maximum angular resolution, the minimum angular resolution, and the average resolution. The average resolution was calculated by taking the image area just at the resolution edge (which has an odd shape) and converting that to an equivalent circle diameter, which equates to a resolution level.
The results are shown in the graph below:

From these tests, I concluded that, for my needs, using 720 Image PPI and the 1440x1440 print quality setting was a good choice. This setting provided a decent increase in resolution while enabling the full P900 resolution at the cost of 4X the image pixels. I would use 720 Image PPI and the 1440x5760 print quality setting if, in rare cases, the image justified a slight resolution or edge quality boost. The small increment in resolution for a portion of the angular space with an Image PPI of 1440 did not seem worth another 4X total image pixels.
I am always open to constructive feedback or spotting errors in my post.
John Wheeler
I ran resolution tests for both PPI image settings and printer Print Quality Settings to determine my go-to settings for good images from my perspective. The test results might benefit others, so I am posting the results.
I limited my testing with the star chart to black-and-white on Epson Ultra Luster Paper, using the four print resolutions of 360, 720, 1440, and 2880 PPI and the three print quality settings of 720x1440 (superfine {SF}), 1440x1440 (photo{P}), and 1440x5760 (super photo{SP}) DPI. I enabled Finest Detail, Fast Speed, and Black Enhance Overlay settings for all the prints.
Here are my go-to results for my needs listed up front for those who just want my bottom line:
- Finest Detail turned on (default)
- Black Enhance Overlay (BEO) turned on
- Fast Speed turned on
- Image PPI set to 720
- Print Quality set to “Photo”
- In the rare case where justified, I would print at 720 Image PPI and printer quality 1440x5760 (not my go-to option)
A Vector Image is used because the starting image has the same spikes at tremendous magnifications. I show the 314-spike Siemens Star with a box 150 mm wide on the left and a zoomed-in view in Photoshop at 340X of a box only 0.44 mm wide. The dark spot is the resolution limitation for my monitor.
When printed, the point at which you cannot resolve the individual spikes determines the resolution by the distance from the center. Equal resolution points are circles, and here is a table showing the diameter of such circles for the listed resolutions:
However, once you convert the vector star chart to a raster image, the resolution is constrained by the PPI of that image.
Here is an animation of the star chart at various image resolutions from 360 to 2880 PPI (the Image is before printing). Note that to make the star chart very clear at X PPI, you must have it rasterized at 2X PPI.
I printed 24 test charts to cover all the desired variations of settings. Twelve were for the topic of this post, and the other twelve are for a future post about the Finest Detail setting.
Here is an example of the star chart before printing. The print is 5.5x4.5 inches and includes an inset of the settings for the shot for better record keeping. The PPI used in the print was written by hand in the margin as they were printed.
The prints were photographed on a copy stand with a 45-Mpixel camera, macro lens, fixed exposure/aperture, and fixed lighting.
PRINT RESULTS
The first three prints are compared in a GIF animation. The animation starts with the star chart printed and then the three prints. The prints were all made at 360 DPI. Print Quality settings were SF=720x1440, P=1440x1440, and SP=1440x5760 DPI
The different quality settings make very little difference in resolution. The reason is that at a 360 PPI image, the resolution limitation is the starting image, which masks any higher resolution capabilities of the printer.
Of note is that each successive higher-quality setting provides a slightly cleaner line edge and a better reproduction of the resolution-limiting starting image.
The following animation is identical to the previous GIF, except the original image was created at 720 PPI.
Printing at 720 PPI is a big step up from printing at 360 PPI, and each successive printing quality level also shows a higher resolution. Additionally, the resolution varies based on the angle. At some angles, it reaches 720 PPI; at other angles, such as the north and south poles, it is worse.
Noticeably, the resolution improved decently from 720x1440 to 1440 x1440 print quality DPI. There is also some difference going from 1440x1440 to 1440x5760, yet the improvement is not as significant.
Is the printer resolution again limited by the original Image PPI? Does 720 PPI create a barrier to even higher resolution?
Here is the following animation with the original Image set to 1440 PPI and all other conditions the same.
NOTE:THIS GIF IS ZOOMED IN BY 2X compared to the prior GIFs
The 720x1440 resolution continues to disappoint. There is some incremental improvement over the Image PPI of 720, yet it is incremental. With 1440x5760, the resolution of the North /South poles also slightly improved.
I did not include the last three prints at 2880 PPI, as they showed no difference from the 1440 PPI image prints. They are at the resolution limits.
To quantify the nine prints I shared in the GIFs, I measured each for the maximum angular resolution, the minimum angular resolution, and the average resolution. The average resolution was calculated by taking the image area just at the resolution edge (which has an odd shape) and converting that to an equivalent circle diameter, which equates to a resolution level.
The results are shown in the graph below:
From these tests, I concluded that, for my needs, using 720 Image PPI and the 1440x1440 print quality setting was a good choice. This setting provided a decent increase in resolution while enabling the full P900 resolution at the cost of 4X the image pixels. I would use 720 Image PPI and the 1440x5760 print quality setting if, in rare cases, the image justified a slight resolution or edge quality boost. The small increment in resolution for a portion of the angular space with an Image PPI of 1440 did not seem worth another 4X total image pixels.
I am always open to constructive feedback or spotting errors in my post.
John Wheeler
Attachments
Last edited: