Profile Assessment

Grandad35

Printer Master
Platinum Printer Member
Joined
Feb 24, 2005
Messages
1,669
Reaction score
183
Points
223
Location
North of Boston, USA
Printer Model
Canon i9900 (plus 5 spares)
I came across this description of soft proofing in a luminous-landscape.com article.
Soft Proofing
Soft proofing is simply a mechanism that allows you to view on your computer monitor what your print will look like when it is on paper. A specific paper. That paper and ink combination has been defined by the profile that you or someone else has made for your printer / paper and ink combination. When a printer profile is made the colour of the paper is one of the factors that is figured into the profile, because the spectrophotometer is reading the combination of the ink, and the paper that lies beneath it.

So, if you were able to view your image through the printer profile, you would be able to see how that particular combination of ink and paper would reproduce it, taking into account the gamut as well as other characteristics of the inks used.
That’s the same link that I included and quoted in post #8.

In your last para, I think we are talking of slightly different things. Softproofing is applied to the profiles as well as images, the purpose being to detect the differences between the BtoA and AtoB tags, which should ideally be perfect inverses, if the softproofing of images is to be accurate. See the Gamutvision ref. in post #7

I have to admit that I did not look at the Gamutvision reference in post #7 before typing my reply, and I now I understand where my disagreement came from. I reread all of the posts in this thread, and they don’t mention the “Gamutvision” package (which I had never heard of). I just assumed that you were doing this “round trip” using a trick that you found someplace in Photoshop or some other package.

The Gamutvision “round trip” is basically the same procedure as described in the link Evaluating an output profile in my post #6, and is not the same as sending an image through the transform in both directions as is done when you soft-proof an image. A few notes:

1. It isn’t stated, but Gamutvision obviously (from the DE plots that both you and they show) creates a set of R/G/B color values that covers the full range of colors (0 to 255 for each of R/G/B). In any case, to test the transformation from the LUTs, it is necessary to run many, many sets of color data through the transform, whether it be from an image or a table of all possible colors.

2. Remove all out-of-gamut colors from the data set, something that isn’t done when soft-proofing.

3. “Round trip tests are normally done with relative colorimetric intent, but perceptual rendering intent is also of interest.” The “Gamut Mapping” diagrams on this link, (written by the man who wrote Gamutvision) shows that a colorimetric rendering intent passes all color values inside the gamut straight through. There won’t be any out-of-gamut colors (which would normally be clipped at the edge of the gamut) at this point, since they were removed earlier.

4. By running the BtoA transform then the AtoB transform on an in-gamut data set using transforms that pass the colors straight through in the in-gamut areas, the resulting data set should match the original. The Colorimetric map in the link says that this rendering intent isn’t reversible, but I believe that this is true only if there are any out-of-gamut colors in the data set.

In summary, I now understand what you are doing. Sorry for the diversion and wasting so much of your time.
 

Emulator

Printer Master
Platinum Printer Member
Joined
Jan 4, 2012
Messages
1,675
Reaction score
1,308
Points
277
Location
UK
Printer Model
Canon Pro9000 II
I haven't, as yet, absorbed the full meaning of your comments, but get the gist. I am sure you will have other comments to make and please do. The process is complex but, non-the-less interesting and there seems to be a lack documentation written in a manner which encourages the newcomer to the subject.

I think I should add that ICC Profile Inspector and wxProfileDump (mentioned in post#3) are recognised by and downloadable from the ICC website.
 
Last edited:

Grandad35

Printer Master
Platinum Printer Member
Joined
Feb 24, 2005
Messages
1,669
Reaction score
183
Points
223
Location
North of Boston, USA
Printer Model
Canon i9900 (plus 5 spares)
Emulator,

I downloaded wxProfileDump (I already had Profile Inspector) and spent some time playing. This post proves the saying that "A little knowledge can be dangerous."

The following chart shows the results from several profiles:
  • The 1st 3 are Canon's profiles for my i9900
  • The next 2 are from Dry Creek's website for their profiles generated for my local Costco
  • The next 2 are mine, generated with an I-one spectro and their software (918 targets)
  • The next 6 are from the Precision Colors website, generated with Mikling's latest techniques ( @mikling )
  • The last 3 are also from Precision Colors, but using an older profiling method
The chart shows:
  • The Mean and Maximum Delta-E values for both the Colorimetric and Perceptual rendering intents.
  • The size of the BtoA LUTs. It there are 2 values, the smaller size is for the Perceptual and Saturation LUTs and the larger size is for the Colorimetric LUT
  • The size of the AtoB LUTs
  • Whether the AtoB LUTs share the same data table (and therefore give the same results)

Misc notes:
  • It is fairly well accepted that Canon's profiles give excellent results when used with their inks and papers (on which the profiles were generated).
  • Dry Creek runs a professional profiling service for many commercial printers, and is an acknowledged expert in profiling. I have printed numerous large images at my local Costco and my family was satisfied with the colors on the prints (I'm partially color blind and not in a position to render such judgements).
  • My family is happy with the colors on my prints using my profiles (and before I started profiling they were not at all pleased).
  • Mikling's latest profiles give terrific round trip performance for the colorimetric intent, and he reports being very happy with the printed results. However, the results for the Perceptual intent aren't nearly as good. Mikling - which intent did you use to print your test prints?
  • The values for the older Precision Colors profiles aren't as good as the newer profiles for the Colorimetric intent, but the Perceptual intent is better than the Colorimetric intent, unlike the results for his new profiles. Even though these older profiles have larger Delta-E values, didn't they give acceptable results?
  • Delta-E is the absolute value of the color difference and will never be a negative number. For this reason, one must be careful when looking at plots of Delta-E to remember this.
Questions:
  • Why are Canon's Perceptual and Saturation BtoA LUTs so much smaller? Why are their AtoB LUTs so small?
  • Wouldn't the "Mean" (average) value for Delta-E be a better number to look at when judging the quality of the profile than the maximum value? This is one instance where a plot might be helpful, as you can see if there is an isolated problem along an edge or if there us a systematic problem.
  • How can the same AtoB LUT work for different intents? This doesn't make sense to me. Note that Dry Creek and the I-One have separate AtoB LUTs for each intent. Is that why the older Precision Colors profiles (which have different AtoB LUTs for the Colorimetric and Perceptual intents) have much lower Delta-E values for the "Perceptual round-trip" than the newer profiles? How does Canon make this work?
  • Given that there is no apparent universal correlation between the maximum Delta-E values and the quality of the prints, is this test a reliable way to predict which profiles will give better prints? Perhaps there is more involved in generating a "good" profile than just minimizing the maximum absolute error. Might not the "smoothness" of the transform be even more important? Isn't the only thing that is really important is how the print looks?
upload_2013-11-3_10-36-42.png
 
Last edited:

Emulator

Printer Master
Platinum Printer Member
Joined
Jan 4, 2012
Messages
1,675
Reaction score
1,308
Points
277
Location
UK
Printer Model
Canon Pro9000 II
Hi Grandad35,
Wow! you have been busy. You've certainly set yourself a lot of questions to investigate.

There are proprietary profiles which adopt their own tag layouts. If you look at the various AtoB and BtoA tags they may be of considerable size but contain very little data. There are then private tags of considerable size which, I guess contain the essential data. The Argyll profiles that @pharmacist produces are of conventional layout and you can follow the structure described in the ICC documentation.
 
Last edited:

crenedecotret

Print Addict
Joined
Oct 5, 2006
Messages
161
Reaction score
52
Points
163
Personally, I don't like Argyll's perceptual intent very much. I'm not surprised of the results. With Argyll, I sometimes overwrite it with it's "luminance based appearance" intent which is similar to relative colorimetric+BPC in Photoshop. However in relative colorimetric, it's very very precise.
 

Emulator

Printer Master
Platinum Printer Member
Joined
Jan 4, 2012
Messages
1,675
Reaction score
1,308
Points
277
Location
UK
Printer Model
Canon Pro9000 II
I suppose it all depends on how Argyll draws in (or leaves them to their own devices), the out of gamut elements in perceptual, as opposed to just chopping them off in relative colorimetric. The results in RC certainly seem to be pretty good.
 

Emulator

Printer Master
Platinum Printer Member
Joined
Jan 4, 2012
Messages
1,675
Reaction score
1,308
Points
277
Location
UK
Printer Model
Canon Pro9000 II
I have been comparing an Argyll profile with a ColorMunki profile (with two optimisations) for the Canon Pro9000 II.

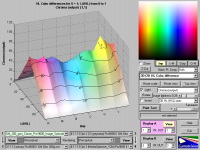
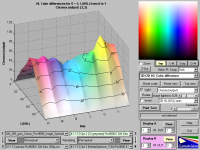
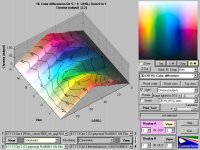
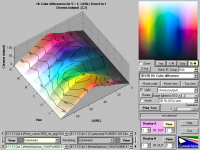
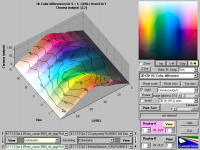
GamutVision has so many display options for comparisons, that you could spend hours playing, but these two show Chroma against L (lightness) - (chroma is maximum at L=0.5 or 50%) and Hue. First image is Argyll, second image is CM. If you click on the thumbnail to enlarge and then click on each little image below the large image, you can alternate quickly!

Argyll 9000 II Chroma output.pngCM 9000 II with 2 optimisations chroma output.png
 
Last edited:

mikling

Printer VIP
Platinum Printer Member
Joined
Jul 2, 2006
Messages
3,239
Reaction score
1,472
Points
313
Location
Toronto, Canada
honestly I am only now starting to absorb what these numbers mean in detail. While making the profiles, I had been bothered that I got some warnings about non monotonic mapping. Then I read a little about what that was about and then Graeme indicated that it was of not much issue and if it looks good, then it is good. By Golly, I was looking at the Delta E at the end of the generation and I was thinking, darn. Delta E of 1 is darn good, the RMS and mean were a fraction of that. The peak errors, I would not worry too much about as it is likely that it occurs in some extreme colors we are not that sensitive to. I kind of remember that Graeme was indicating that a peak of 10 was still acceptable. Then I was looking at the prints and all I can say is with the new profiles, it looks darn good. I have no complaints and throroughly pleased with the i1Pro and Argyll combo. I'm too busy right now with the technical details to figure out what is going on to be honest. Over time, I will look into it very detailed.
The Datacolor spectro and software is not in the same category and it should not be compared really...So I am tossing out the old profiles and doing a new total set for all the printers I support. One reason why I am busy.

All I can say, I waited too long to get that i1pro and try out Argyll. If I was given these profiles to use with specific papers etc. years ago, there would be nothing more I would want. It is simply a recipe to get superb prints beyond what many think is in their hands on that little desktop printer.

Grandad's statement" Isn't the only thing that is really important is how the print looks?" and YES, they look fantastic! That's what counts. it's like audio again, you can measure the distortion etc. but if it sounds good, isn't that what really counts?

I am using RC now. It seems to produce better results but on most prints, the differences are not really perceivable really. So where the peak errors are occurring is the question really.
 
Last edited:

Emulator

Printer Master
Platinum Printer Member
Joined
Jan 4, 2012
Messages
1,675
Reaction score
1,308
Points
277
Location
UK
Printer Model
Canon Pro9000 II
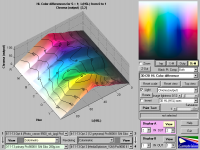
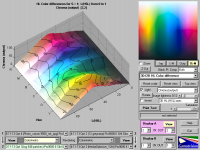
Above Primary.pngAbove Optim 1.pngAbove Optim 2.pngAbove Optim 3.pngAbove Optim 4.png

I have been uncertain whether the optimisation process in ColorMunki, is effectively restricted to two inputs, as is often implied, although not in the ColorMunki instructions.
To investigate the question, I have produced an entirely new profile for Sihl glossy 280g/sm and carried out 4 stages of optimisation on the primary profile.
To try to demonstrate the results, these 5 images of the chroma behaviour, generated in Gamutvision, represent the primary profile and the subsequent optimised versions of the profile.
It can be seen that changes occur with each optimisation, albeit apparently small changes and in some, slightly reversing previous changes. Not unlike homing in on an ideal target.
The file images I used to optimise the profile were:-
First optimisation - pharmacist’s 648 patch A4 sheet image file, used in producing the Argyll profile.
Second optimisation - A 12 step grey ramp file.
Third optimisation – The multi coloured spectral file MediaOptimiser_V2.tif.
Fourth optimisation – An image file of multi-coloured wild flowers, among grass, a backdrop of trees and an aged grey wooden seat. Photo_canon 9500_mk_i.jpg.
I have used the resulting profile to print various images and am very pleased with the results. My judgement is that the optimisation process does continue to improve the profile with each step. How many steps are worth taking I am not sure, I think it is likely to be a process of diminishing returns, unless there is a specific colour shade which requires attention.
 

crenedecotret

Print Addict
Joined
Oct 5, 2006
Messages
161
Reaction score
52
Points
163
Mikling- you can have argyll generate a test file showing the Delta-E for all your scanned patches. This can help you find strips or patches with scanning errors. You can often re-scan them or simply delete them. This can lower your peak errors, assuming the peaks are due to a bad scan. I'll find the commands for you....

I've been playing around a little bit with the X-Rite software this week. I previously had better luck with Argyll as I use Linux and can use it natively. To use the X-Rite software I have to use Virtualbox. With the X-Rite software I was always getting slight color casts in grayscale images and something looked a bit unnatural. Since I run it virtualized, I output to a PDF printer, then print it from my Linux setup. I swapped out the PDF printer this week for a different version, and then went through every single setting to find there was something wrong with my workflow (The PDF printer was set to CMYK mode, changed it to RGB). Now I am getting great results, and to be honest I am so surprised at the results I am getting from 200 patches (2 optimizations) squeezed onto a Letter sheet.

Emulator - Since you have Gamutvision.. maybe you will want to try this.. for optimizations, I first ran a grayscale optimization using a collage of several black and white images. This seemed to generate more patches and work better than only using grey ramps. I then did the same using another collage of real life pictures with a multitude of colors like greens, skin tones, earthy colors, flowers, etc. This seems to be giving me better profiles to use with actual real life pictures than using special test images which contains many colors we will never see in real life. Maybe adding the test images as optimizations AFTER real life images would work well too, but at that point, beyond the theoretical, if there really any return on investment after two optimizations? Is there any visual different on real life pictures?

All this being said, I might stick to a combo of Argyll and the X-rite software (a windows users can swap the colormunki and reboot to switch between the two apps). The original software is great for quick profiles to test new papers. I was able to do a decent profile for printable CDs by breaking up the targets to a few discs (needs a bit of patience) which was WAY too much work with Argyll (had to place patches one at a time and I needed way too many patches to be practical). Something I might try.... a Colormunki profile could be a very very good pre-conditioning profile to use with Argyll.
 
Top